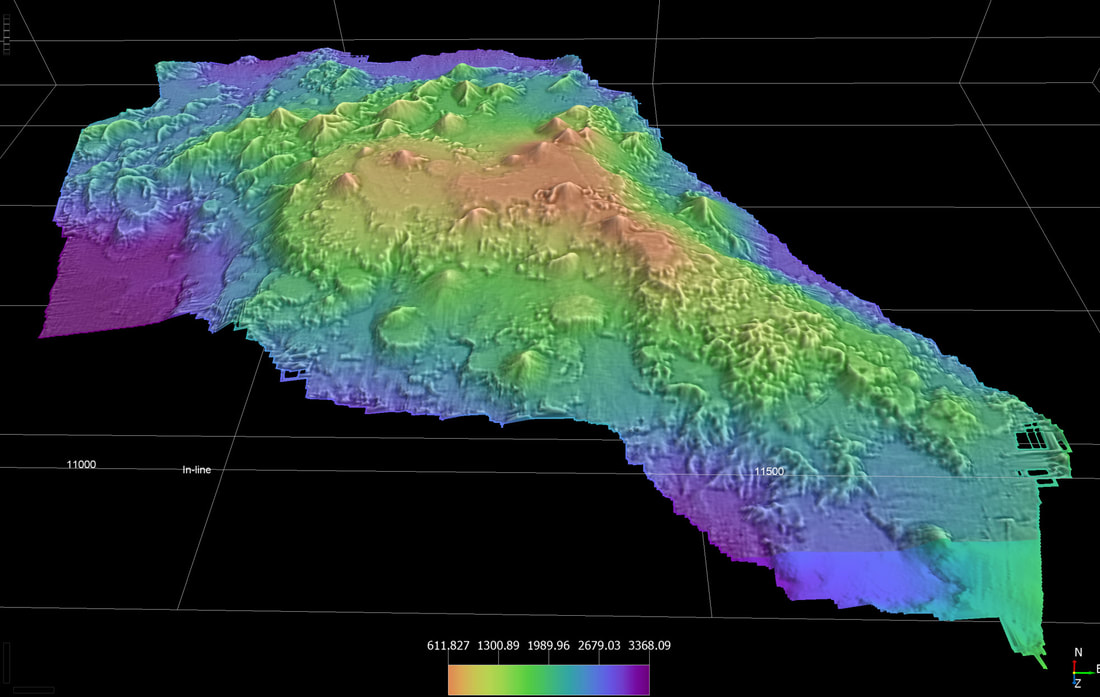
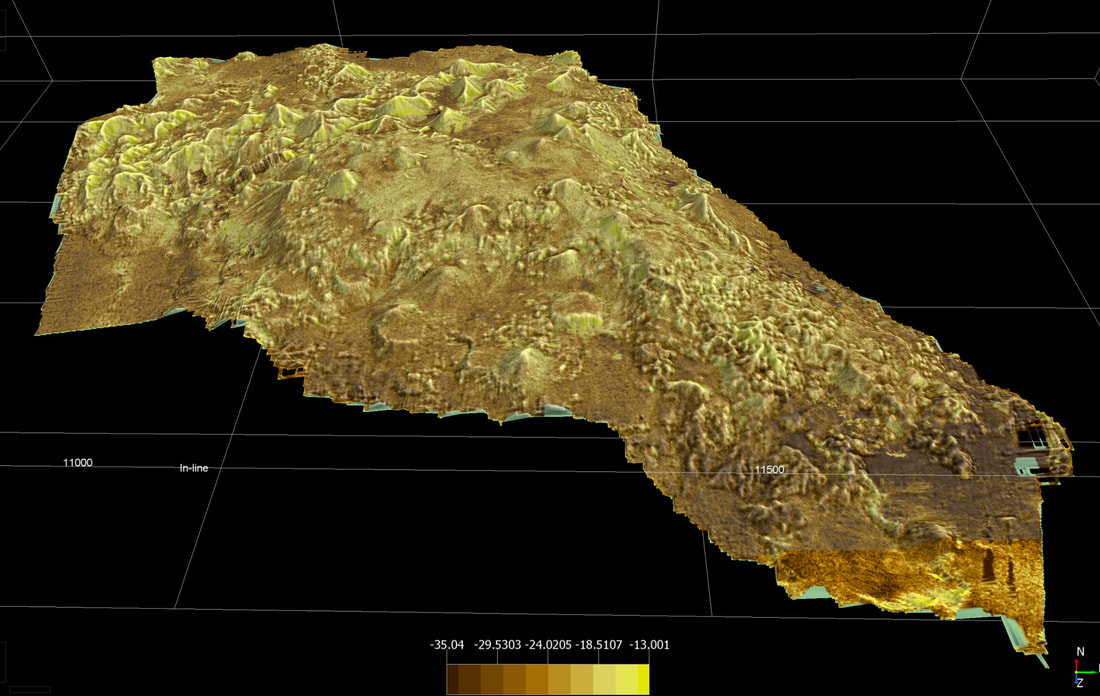
Multibeam bathymetry / multi-attribute perspectives of Hodgkins Seamount from data collected in 2018, loaded and processed in OpendTect.
The upper visualization shows elevation data with topographic curvature overlaid to emphasize structural features; mounds/cones and ridges may represent volcanic cones and dikes respectively. The lower figure combines bathymetry with backscatter mean curvature transparently overlain (brown to yellow colors); darker areas may represent softer sediments, which appear to accumulate in the lower and flatter areas. Additional marine datasets could enhance future analysis.
Elevation (m) in color with mean topographic curvature transparently overlain to highlight key edges and features.The same 3D perspective with backscatter mean curvature transparently overlain (brown to yellow colors).
Salish Sea Climate Mandala
March 12, 2013
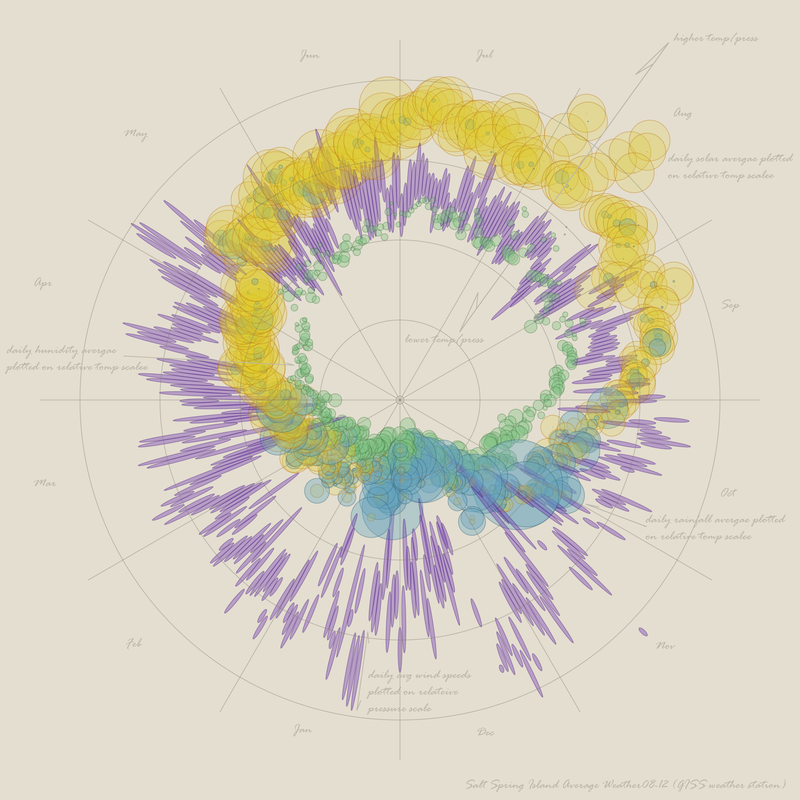
An aesthetic and holistic way of viewing local climate patterns: a mandala-inspired visualization of five years of weather data from the Gulf Islands Secondary School station on Salt Spring Island (Salish Sea region).
Five-year daily averages of selected weather measurements are displayed radially in time, with summer at the top and winter at the bottom. Circles represent solar insolation and precipitation; daily average wind speeds are represented by indigo ellipses; humidity and temperature complete the composition. The final graphic was generated with the Processing software environment.
Five-year daily averages displayed radially in time, summer at top and winter at bottom.